In statistical analysis and scientific research, it is crucial to understand the differences between correlation and causation and to use sampling techniques effectively in order to draw accurate conclusions. Correlation refers to the relationship between two variables, while causation refers to a direct cause-and-effect relationship. Sampling allows researchers to study a population based on a…
Tag: data analytics

Data Analysts, Data Engineers and Data Scientists
Data analysts, data engineers, and data scientists are all professionals who work with data to extract insights and inform decision-making. While there is some overlap in the skills and responsibilities of these roles, they each have their own distinct focus and responsibilities. Data analysts are responsible for collecting, organizing, and analyzing data to inform business…
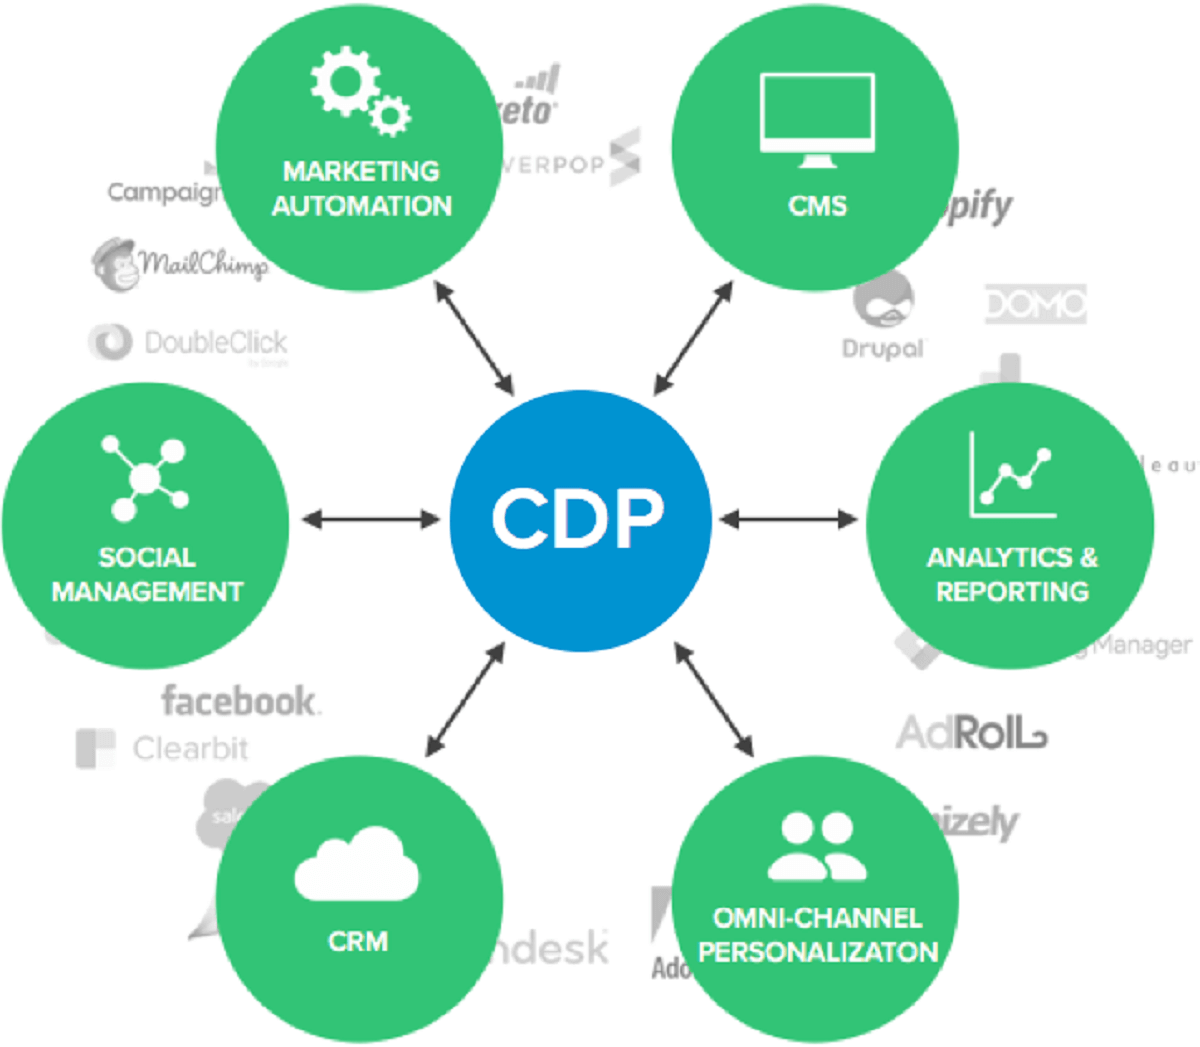
Customer Data Platforms (CDP)
Customer Data Platforms (CDPs) are a type of software that helps companies collect, store, and manage customer data from various sources, such as web analytics, CRM systems, and marketing automation tools. The goal of a CDP is to create a single, comprehensive view of the customer, which can be used to improve marketing, sales, and…

Formulas and Functions in Microsoft Excel
Commonly used formulas in Excel Microsoft Excel is a powerful tool for working with and analyzing data. It offers a wide range of formulas that can be used to perform a variety of calculations and functions. One of the most basic and commonly used formulas in Excel is the SUM formula, which is used to…
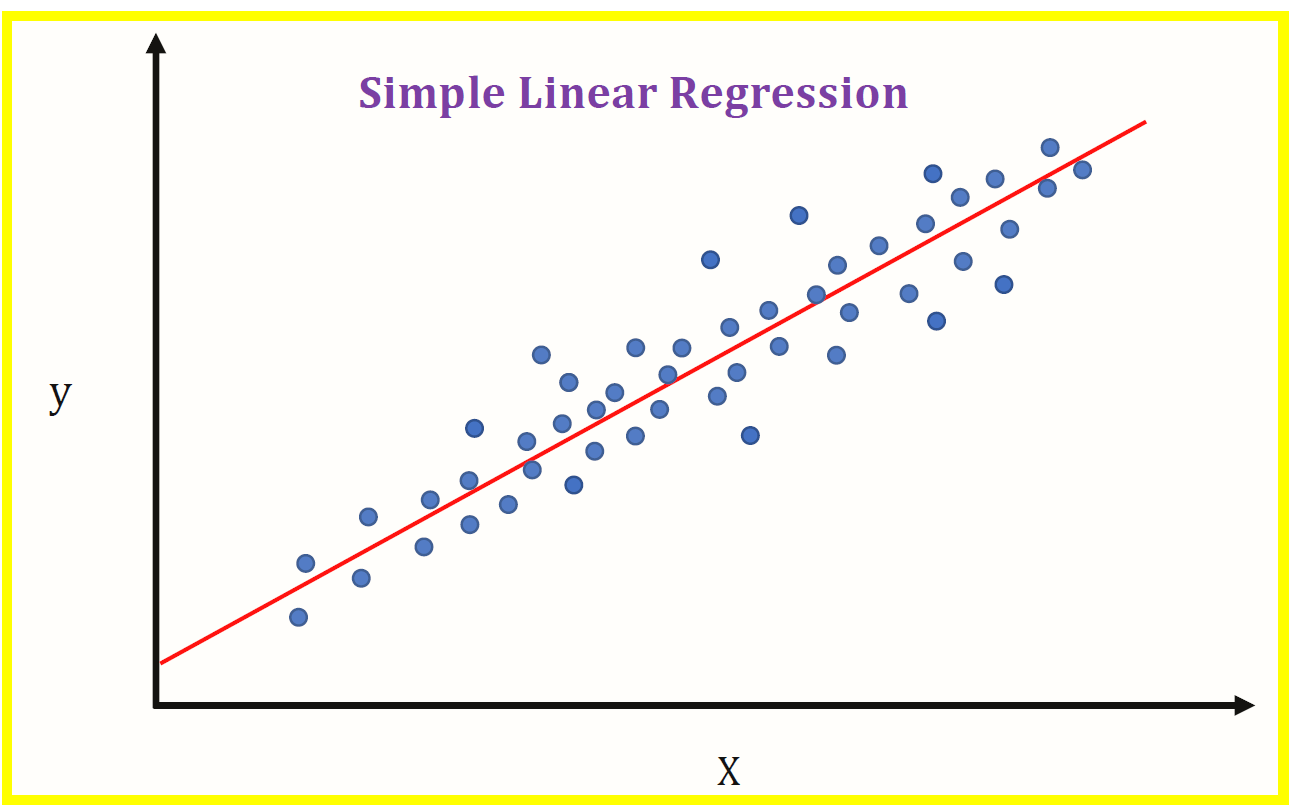
Linear Regression and Regression Analysis
Linear Regression Linear regression is a statistical technique used to analyze the relationship between two or more variables. It is a type of regression analysis that is used to model the relationship between a dependent variable and one or more independent variables by fitting a linear equation to the observed data. Linear regression assumes that…
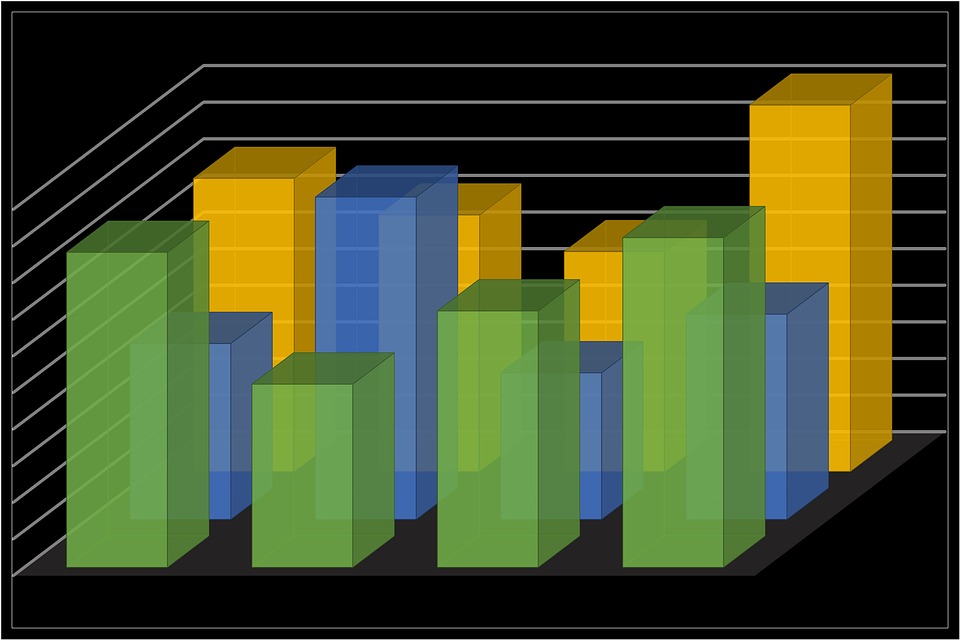
Statistical Analysis
Statistical analysis is the process of collecting, organizing, and interpreting data in order to draw conclusions and make decisions based on that data. It is an essential tool for many fields, including business, economics, and the social sciences. The first step in statistical analysis is to collect the data. This may involve conducting surveys or…
Qualitative and Quantitative Analytics
Quantitative and Qualitative Analytics and their use cases. Qualitative and quantitative analytics are two different approaches to data analysis. Qualitative analysis involves examining and interpreting data in order to understand underlying meanings and patterns. This type of analysis is often used to gain insights and generate ideas, and is typically used in the early stages…
Microsoft SQL Server, Power BI & DAX
What is Microsoft SQL Server and what are the primary benefits of using it with Power BI? Microsoft SQL Server is a relational database management system (RDBMS) that is used to store, manage, and analyze data. It is designed to support a wide range of data types and formats, and it provides a range…

The Benefits of Using Cloud Data Warehouse
What are the benefits of using a cloud data warehouse? A cloud data warehouse can be a valuable tool for digital marketing. Some of the benefits of using a cloud data warehouse include: Increased scalability: A cloud data warehouse can easily scale up or down to meet the changing needs of your business. This is…
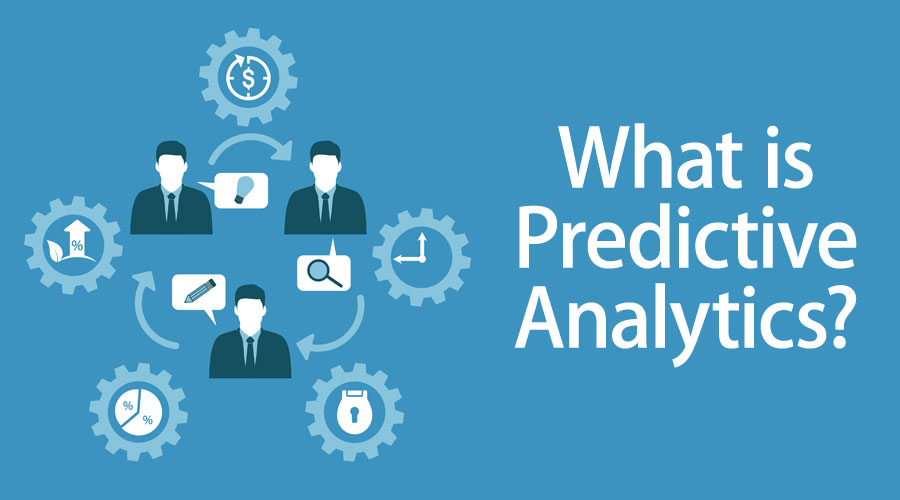
Predictive Analytics
What is predictive analytics and its best use case? Predictive analytics is the use of data, statistical algorithms, and machine learning techniques to identify the likelihood of future outcomes based on historical data. This can include predicting the likelihood of a customer making a purchase, the likelihood of a patient developing a certain disease, or…

